The Weekly Close #14: ₿uy the dip
Last chance to buy bitcoin below the 200-week moving average?

Dear friends,
Welcome to the latest edition of The Weekly Close. Every Monday morning, we look at the weekly bitcoin chart to find out what developed in the last seven days and what this could mean for the week ahead. Let's dive right in!
📉 The weekly bitcoin chart
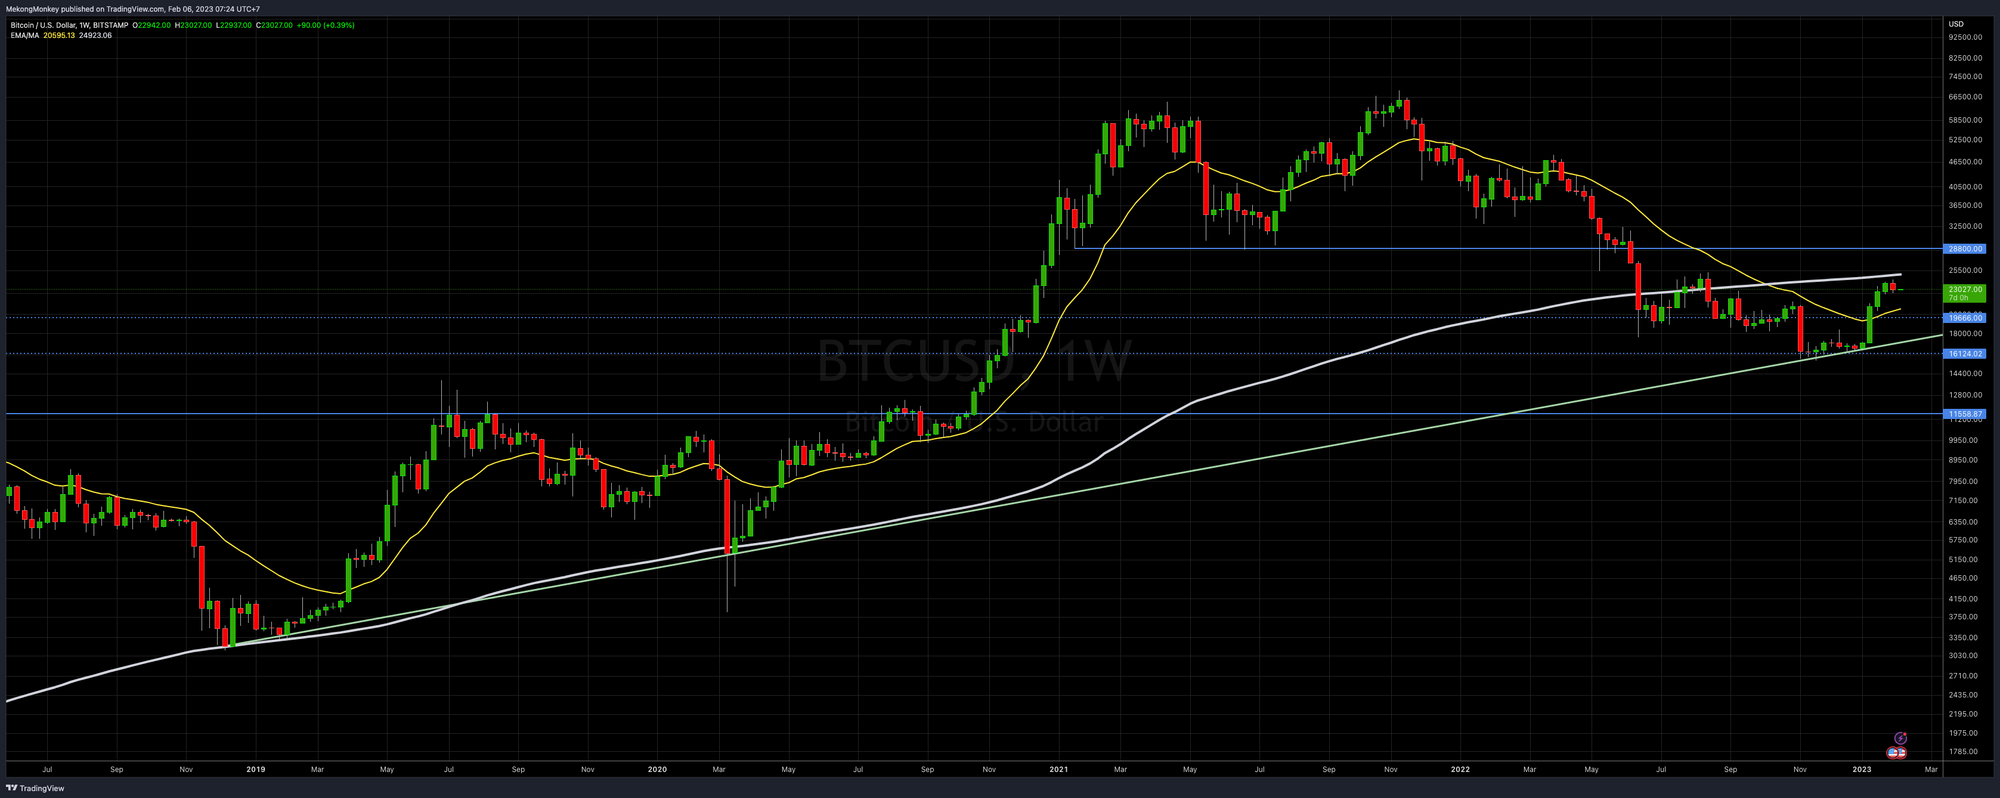
Pictured above is our trusty BTCUSD weekly chart with the usual Horizontal Support Resistance levels (HSR, in blue), the bullish trend line in green, the 21 weekly Exponential Moving Average (21 EMA, in yellow), and the 200 weeks Simple Moving Average (200 SMA, in white).
There are no surprises here. In the last couple of weeks, bitcoin has been gently rising toward the 200 SMA, around $25K. In early January, the price broke out of the mid-range cluster between $16K and $20K, closed above the 21 EMA, and hasn't looked back.
As expected, now the price is running into resistance just below the 200 SMA, which acts as the dividing line between bulls and bears. However, if we look closer, we can see that the pullback has been minor so far:
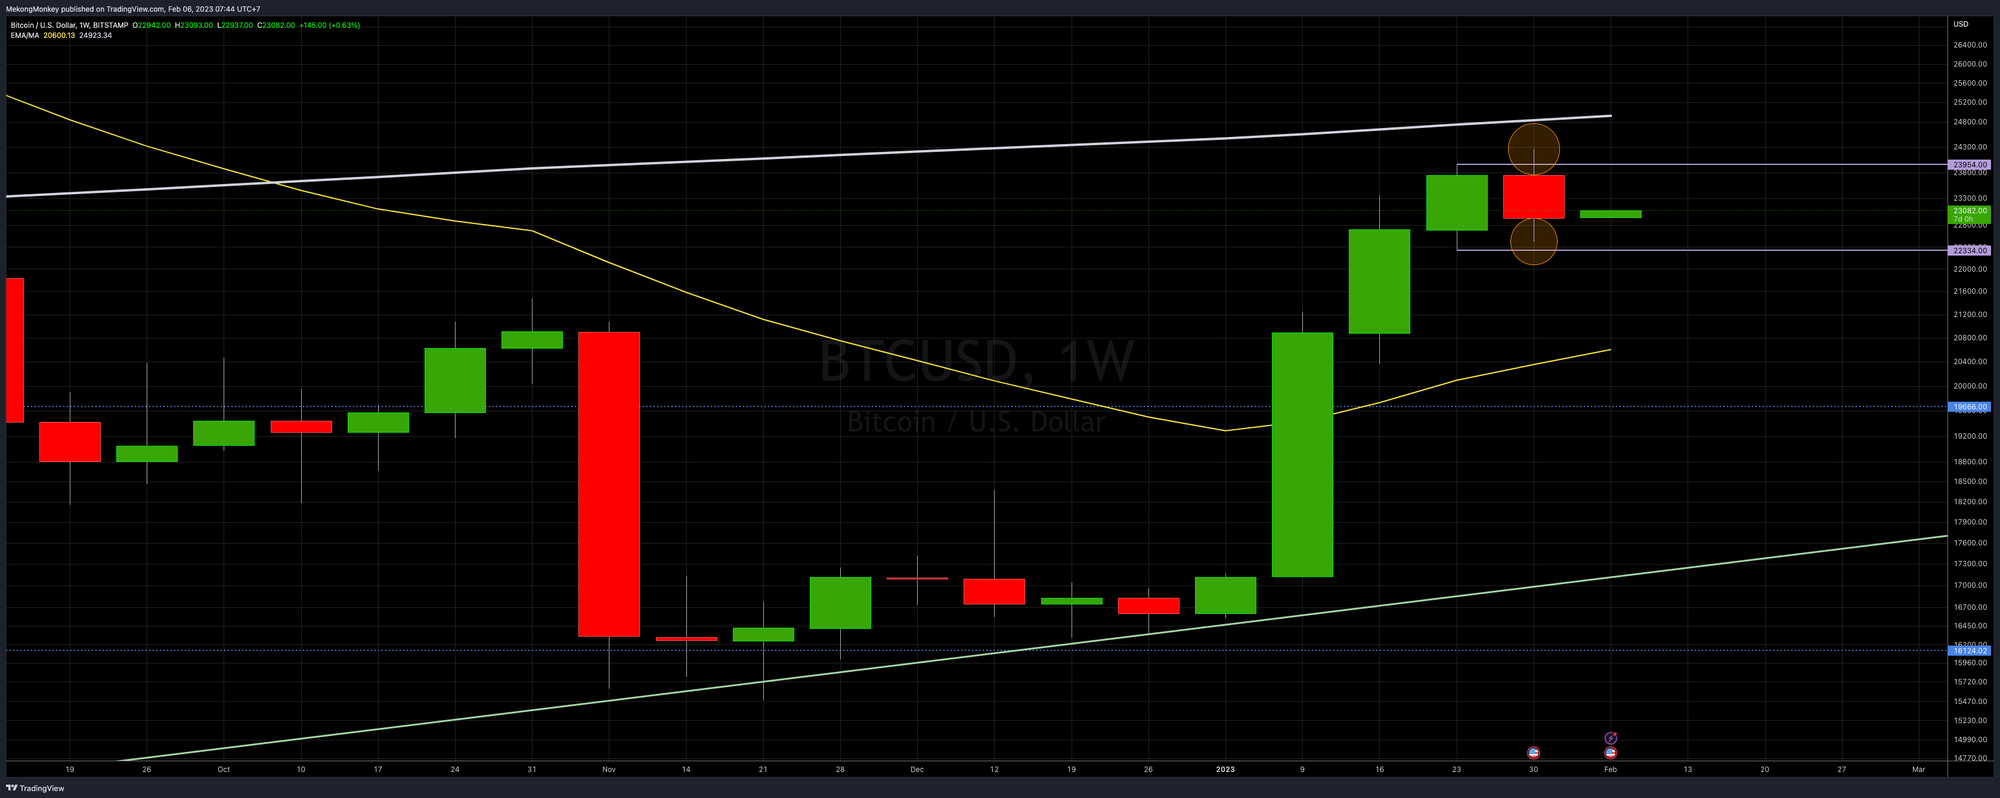
Although the latest weekly candle is red, the price wicked above last week's high and didn't dip below last week's low. We believe this suggests a lot of strength.
The momentum indicators confirm that bulls are taking control:
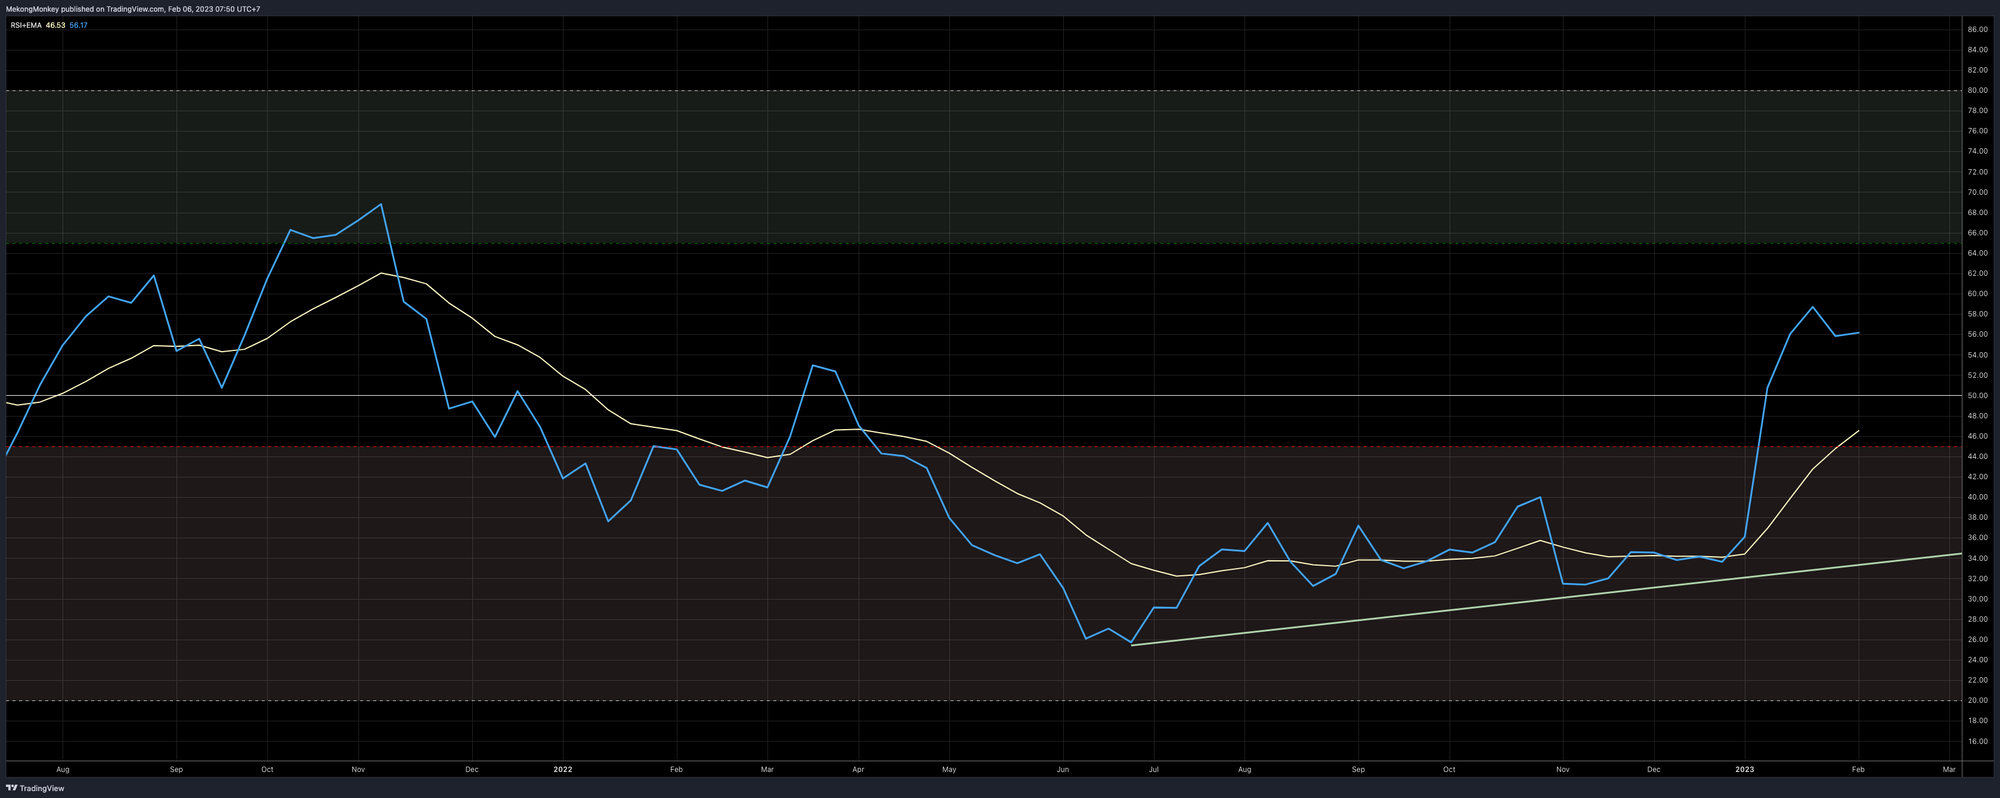
The best news is that there's still lots of room above. The Relative Strength Index (RSI, in blue) broke out of bearish territory (the red area), crossed the midpoint (white horizontal), and sits currently around 56, a level not seen since November 2021. We only need to get worried about running out of steam with a reading above 80. The proper bullish territory only starts above 65. So the RSI is predicting many weeks of upside still ahead.
The Stochastic oscillator, on the other hand, paints a more nuanced picture:
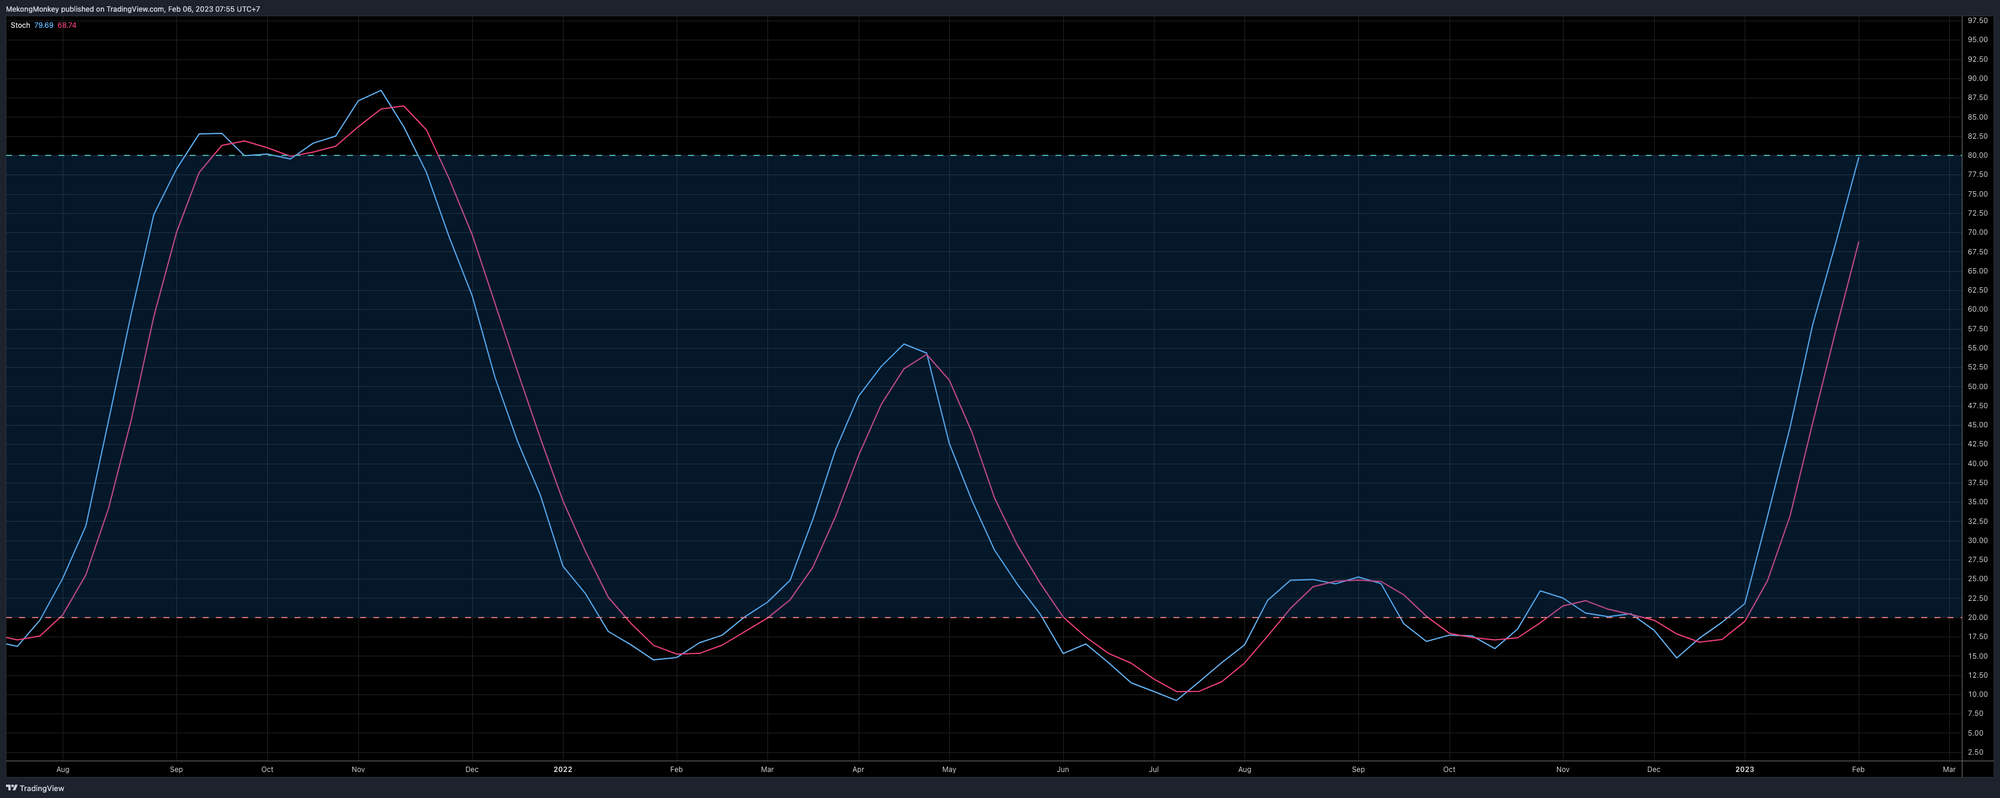
This momentum indicator moves from the oversold territory (below 20, when sellers are exhausted and the price has likely reached a bottom) to overbought territory (above 80, when buyers are finished and the price has likely reached a top). As we can see, the oscillator is rapidly approaching 80. This doesn't mean we'll immediately go down in a straight line from here, but it might suggest some caution is in order.
🔮 To bring it all together:
Bitcoin has escaped from the lows and found a comfortable space above $20K. The major challenge ahead remains the 200-week SMA of around $25K. However, the price is holding up incredibly well in the near vicinity of this significant resistance. The dip has been extremely shallow so far. It looks more like sideways consolidation than an actual pullback.
While technically, we're still in bearish territory, and many market participants seem to be waiting for a dip back to $20K, we still lean bullish and think there's a fair chance we'll smash through the 200 SMA without allowing hesitant buyers to get in at much lower prices.
Especially when looking at the market with a longer time frame, bitcoin below the 200 weekly SMA is an absolute bargain. We believe buying below $25K is an exceptional opportunity before the price explodes to the upside, sooner or later.
🔥 Where are you on this chart?
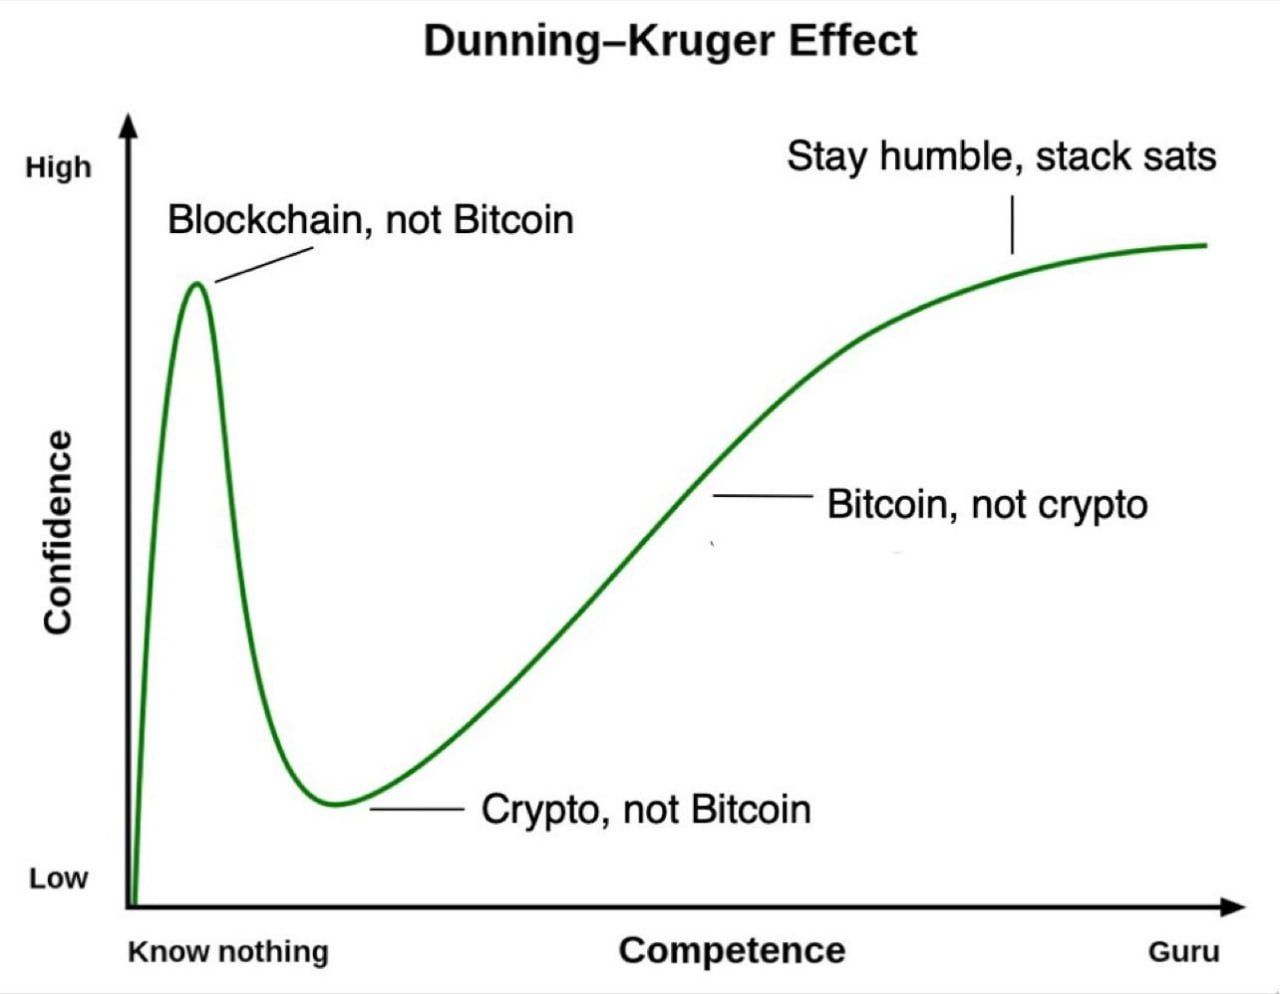
The Dunning-Kruger effect occurs when a person's lack of knowledge and skills in a particular area causes them to overestimate their competence. By contrast, this effect also causes those who excel in a given area to think the task is simple for everyone and underestimate their relative abilities.
Have a wonderful week, dear friends; take good care of yourself and your loved ones. You can reach us on Twitter, Telegram, or e-mail if you have any comments, questions, or suggestions.
Greetings from Phnom Penh, and talk again soon!

Support The Weekly Close by using these excellent services:
- HodlHodl: buy and sell bitcoin peer-to-peer without counterparty risk.
- Rollbit: up to 1000X bitcoin leverage futures. Instant execution. 0% Slippage. 0% Fees on loss.
- Satsback: earn sats when shopping online.
We appreciate your support! ⚡mekongmonkey@stacker.news
Not trading advice. You are solely responsible for your actions and decisions.
