The Weekly Close #6: Thank God it's December
Bitcoin seems to have found a bottom, and we expect it to remain in the 16 - 20K range this week.

Dear friends,
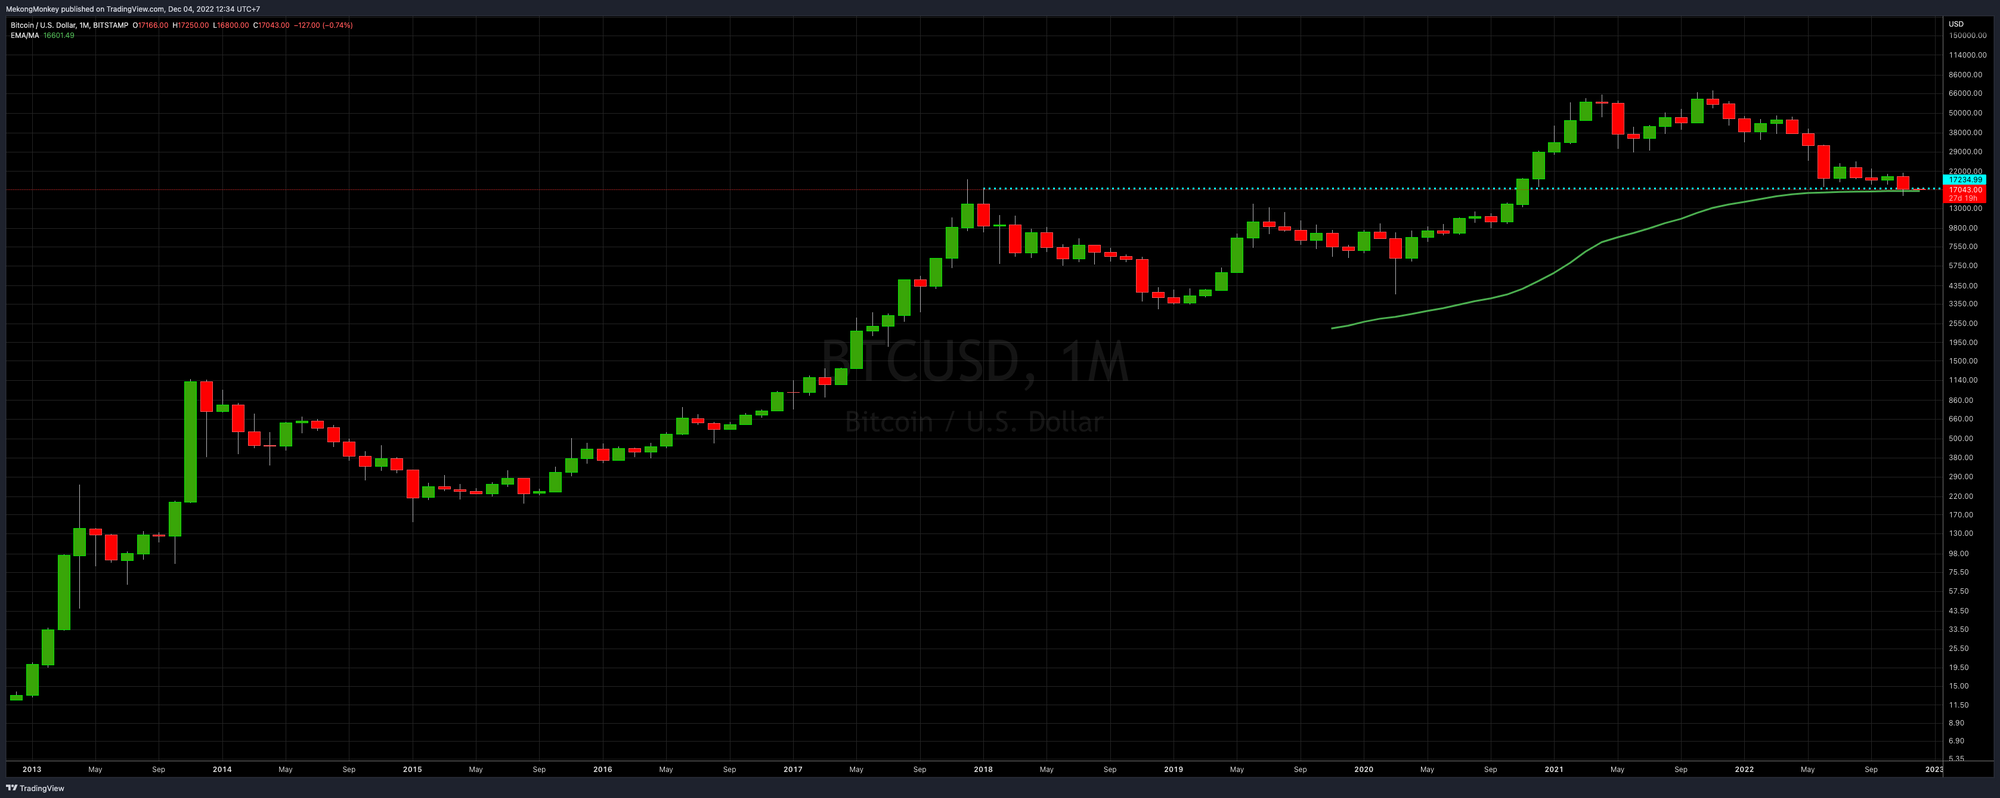
We're finally done with November. It was a long and ugly month for bitcoin. The monthly chart shows a fat, red candle that found Support at the 100 EMA (the 100-month exponential moving average, the green line) around 17K. There's also a critical monthly HSR (Horizontal Support/Resistance) level around 17K, where bitcoin was violently rejected in January 2018, only to be reclaimed in November 2020:
Bottom signal of the week:
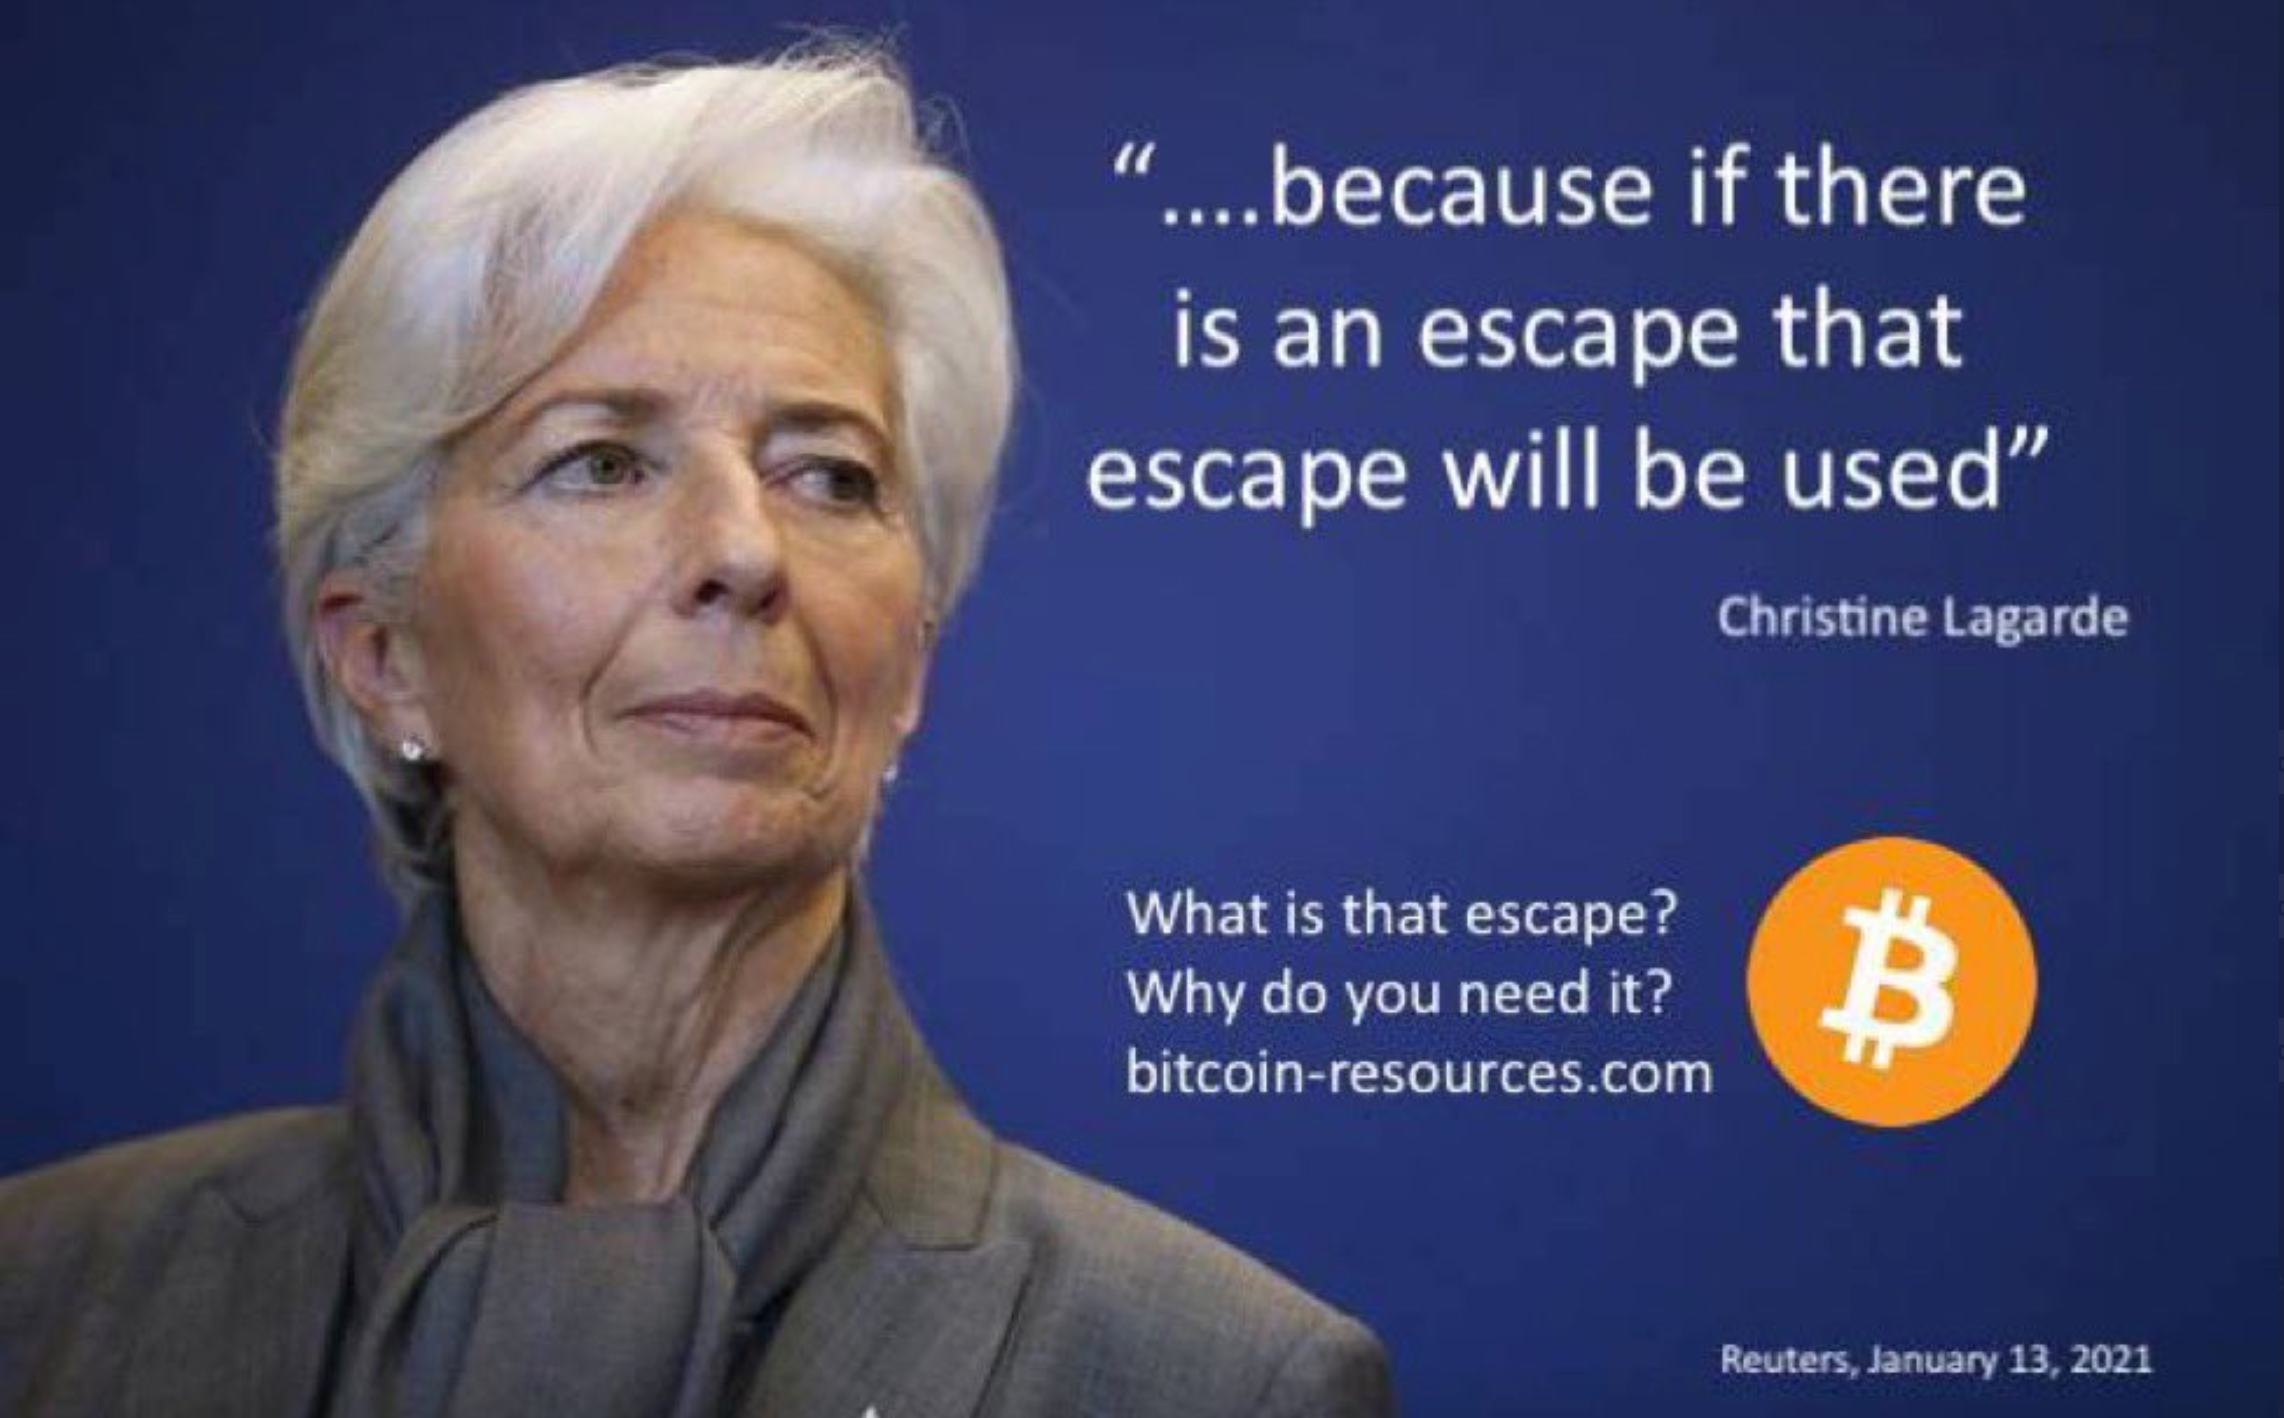
The European Central Bank (ECB), with convicted criminal Christine Lagarde as president, came out with a very dramatic titled blog post, “Bitcoin’s last stand.” As expected, the post is full of scary language and misinformation.
Christine Lagarde and her cronies show their fear about the one thing that can take their power away:

Indeed, when the ECB celebrates the impending death of bitcoin, the bottom must be in!
Now let's dive into the weekly charts:
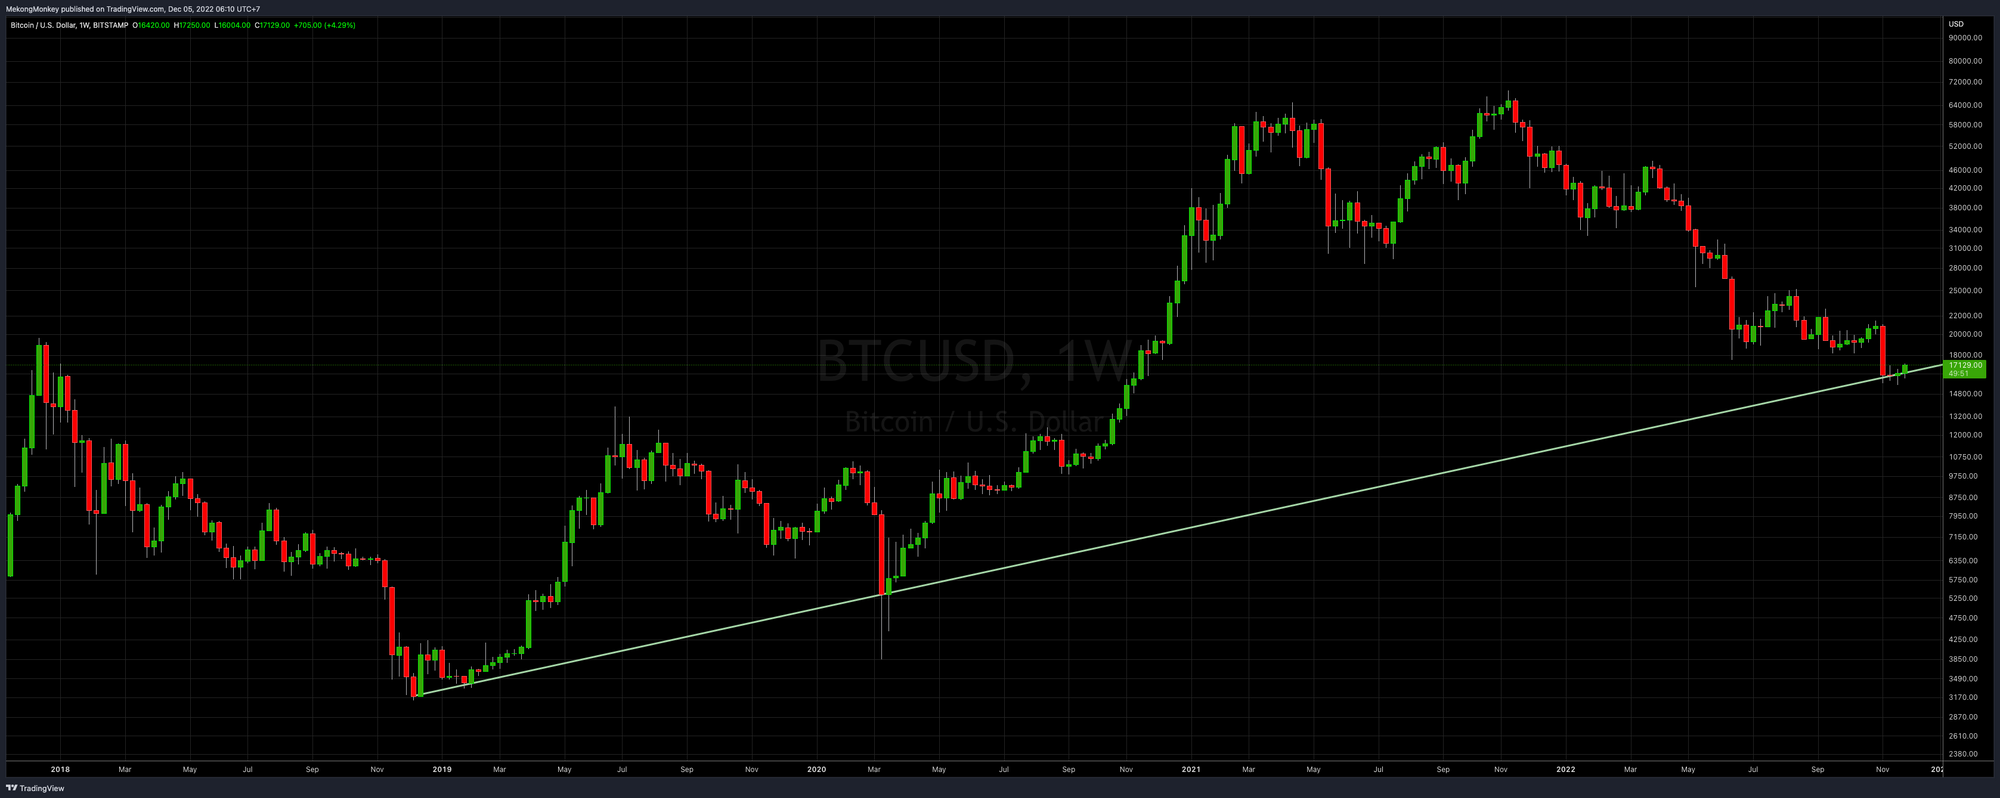
BTCUSD printed a green candle last week. In issue #4, we connected the 2018 bottom with the 2020 covid crash weekly close (green diagonal line) which joined with the FTX blow-up from early November. It's good to see how the price is respecting this bullish trend line, and now we can see a move up and away from it.
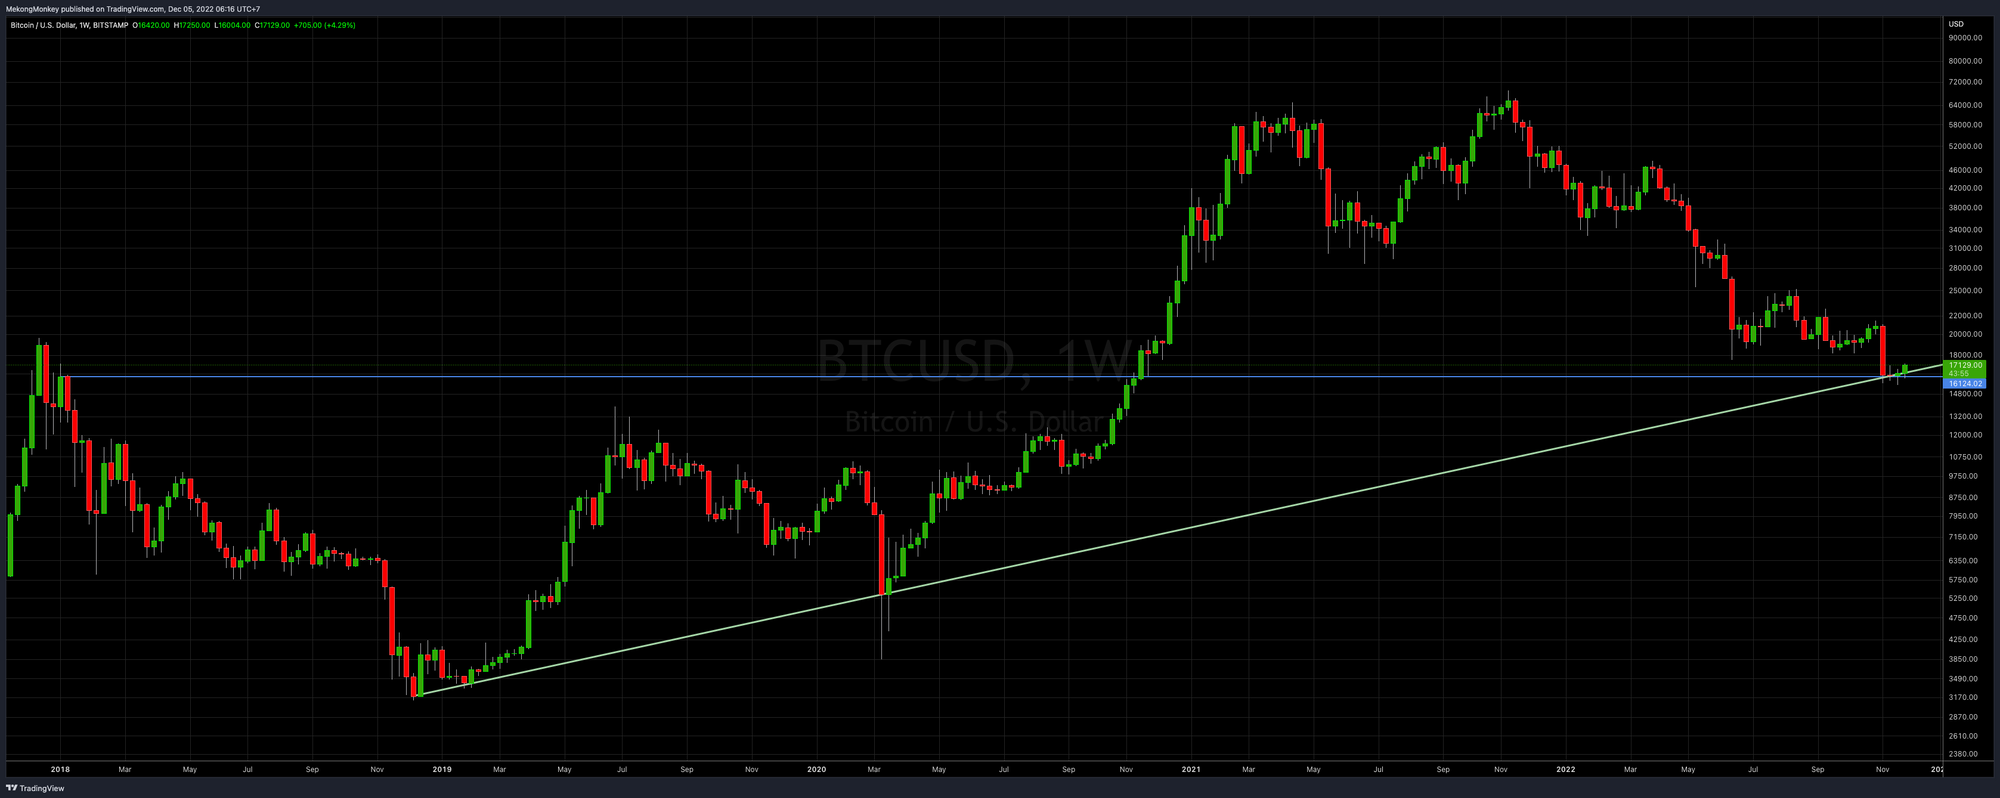
Adding the main HSR level around 16K, we notice how it nicely aligns with the bullish trend line, providing a nice cushion of Support for the price at these levels.
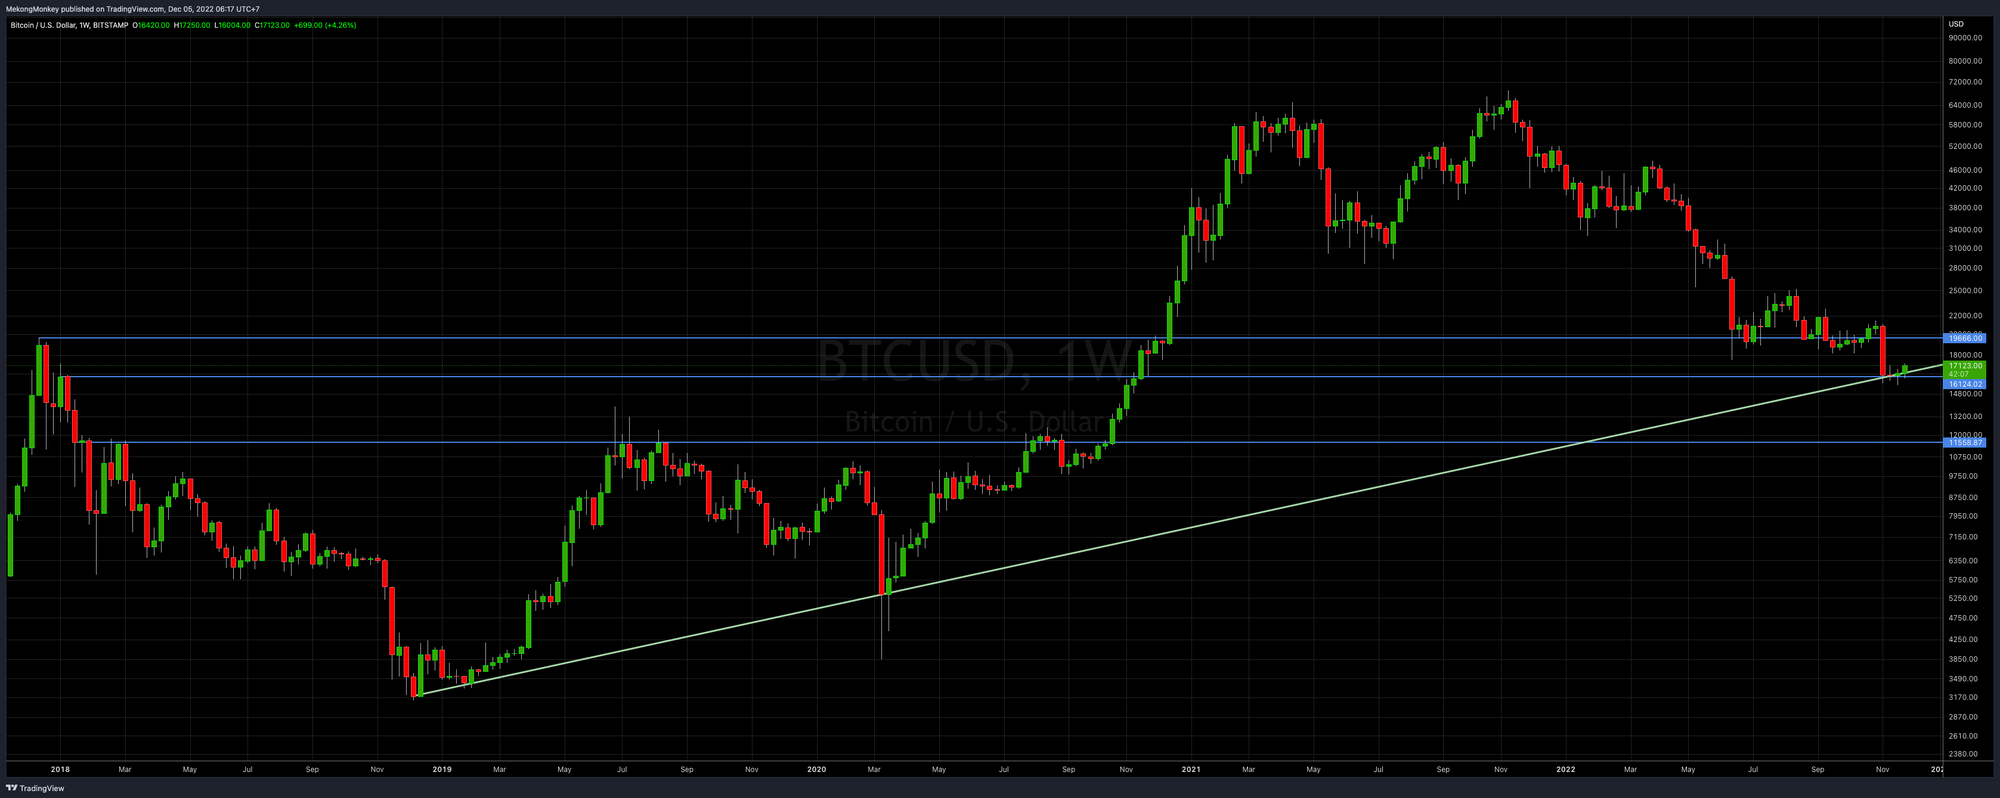
Finally, we add the nearest HSR levels, around 20K and 12K. Here we can see bitcoin is trading in the 16 to 20K area. We've left the 12K HSR level in the chart, although it looks like we have avoided another leg down for now.
Momentum is very much in favor of bullish action:
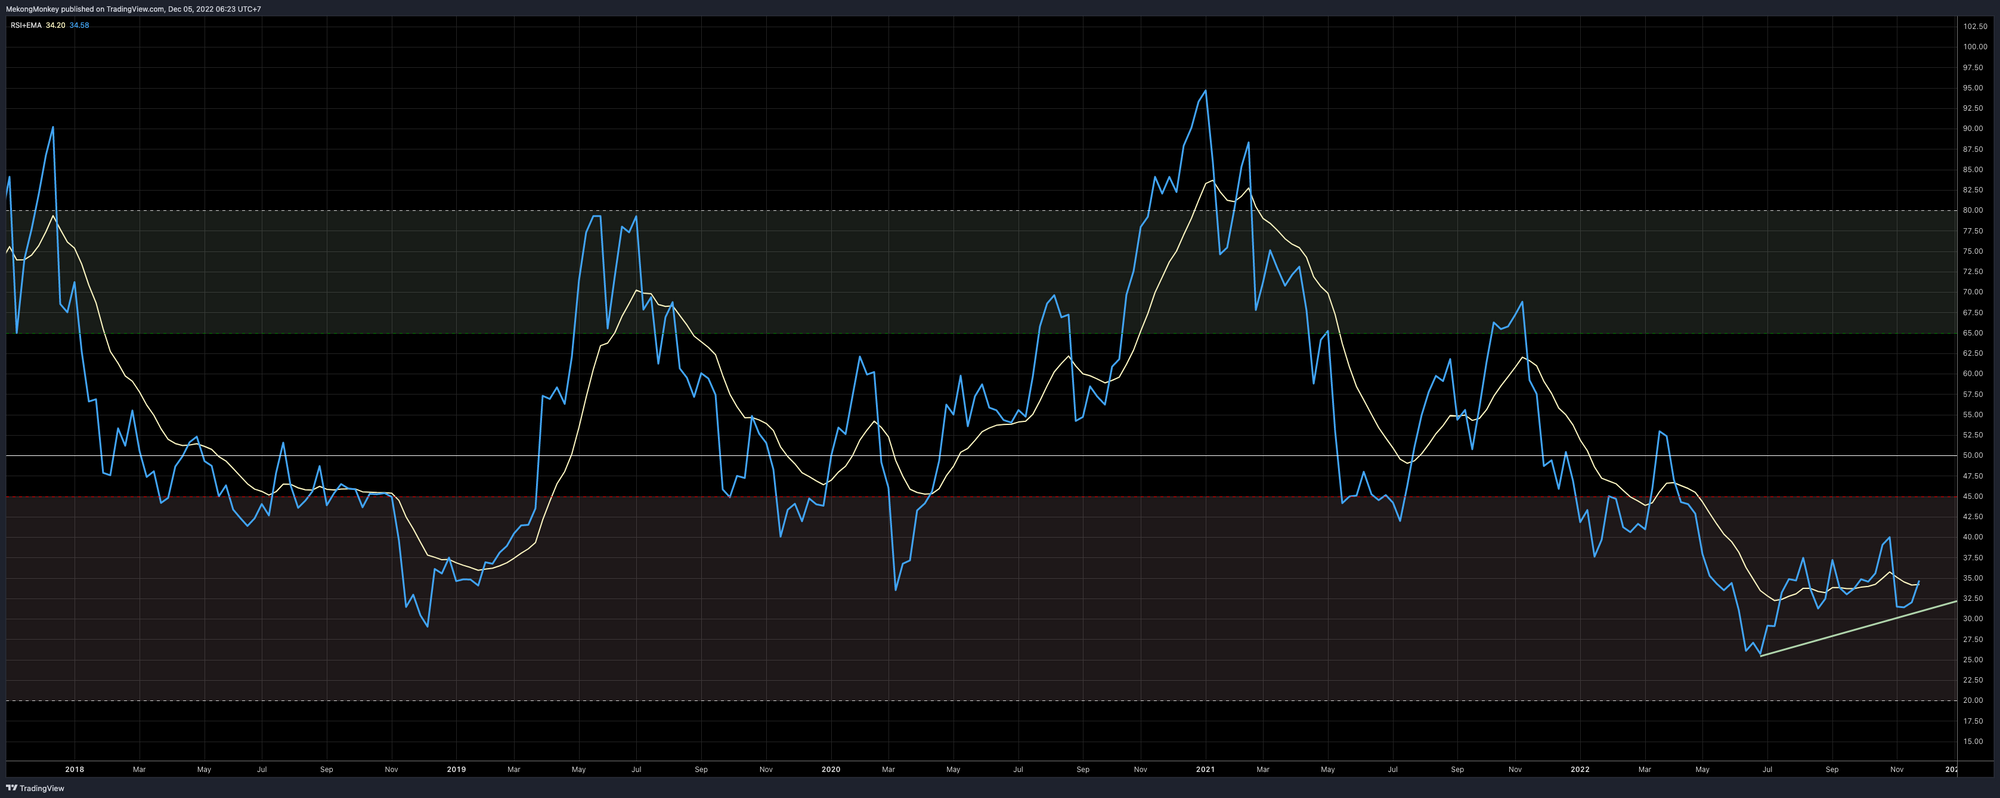
Notice how the RSI has been on a steady uptrend since June and is now crossing its EMA again (the blue line crossing the yellow line).
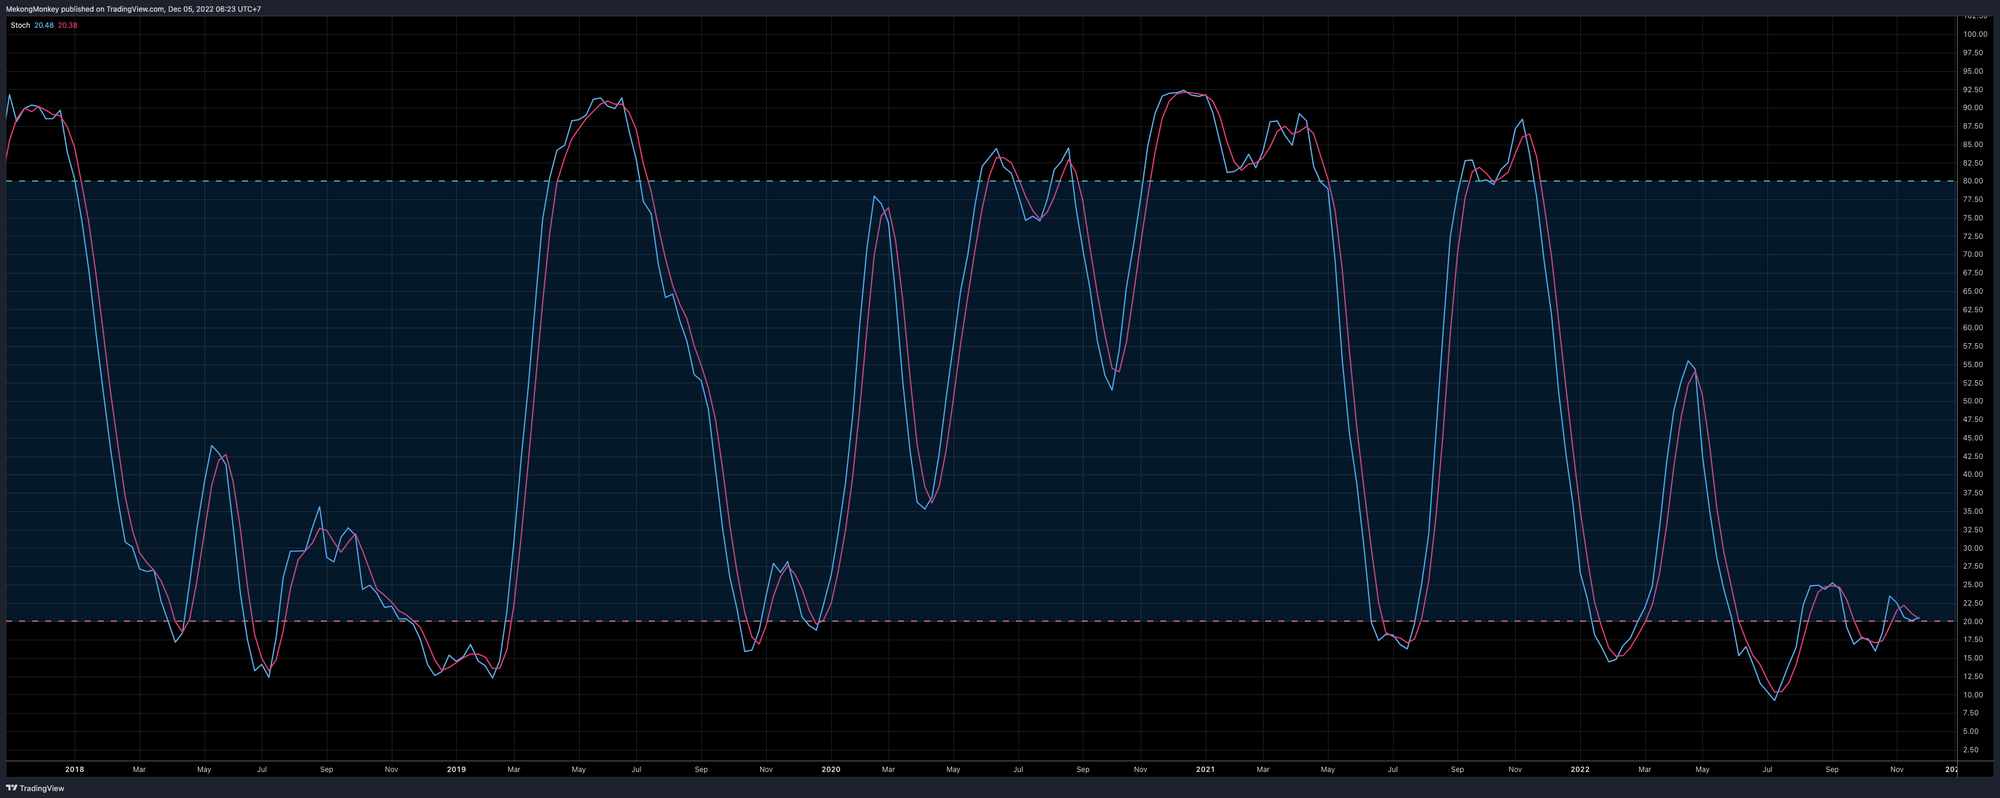
The stochastic oscillator escapes oversold territory (the area below the red dotted line). It has plenty of room to rise before reaching overbought conditions (above the green dotted line on top).
To bring it all together:
The market conditions are very similar to the end of October (check out issue #2 for full details): the price is moving up and away from Support while momentum indicators confirm the move. Bullish continuation toward 20K is the most likely path forward from here. With the end of the year approaching and the confidence of regular investors still shaken by recent events, we probably shouldn’t expect massive green candles anytime soon. However, BTCUSD seems to have found a bottom, and we expect it to remain in the 16 - 20K range this week.
For long-term investors, this is excellent territory to build out a position at heavily discounted prices.
For the more short-term oriented traders: there's an explicit invalidation of our thesis if we dip below 16K again.
Inspirational video before you go:
Dylan Leclair, head of Market Research at Bitcoin Magazine Pro, does a brilliant job answering the question “Why Bitcoin? (and only Bitcoin)” in 15 minutes:
It’s the perfect way to remind yourself why we’re on this trip or a great introduction to show to no-coiner friends and family.
Have a wonderful week, dear friends, and take good care of yourself and your loved ones. You can reach us on Twitter, Telegram, or e-mail if you have any comments, questions, or suggestions.
Greetings from Phnom Penh, and talk again soon!

Not trading advice. You are solely responsible for your actions and decisions.

